Camera footage in. Classified traffic counts out.
VehDet turns days of roadside video into traffic counts by direction and vehicle type, every 15 minutes. You can check every number against the video, and the results are ready for your transport model.
Four steps from footage to a finished count
Each step has its own page in the tool. A survey team sets things up once, the machines do the counting, and people review the results before they are delivered.
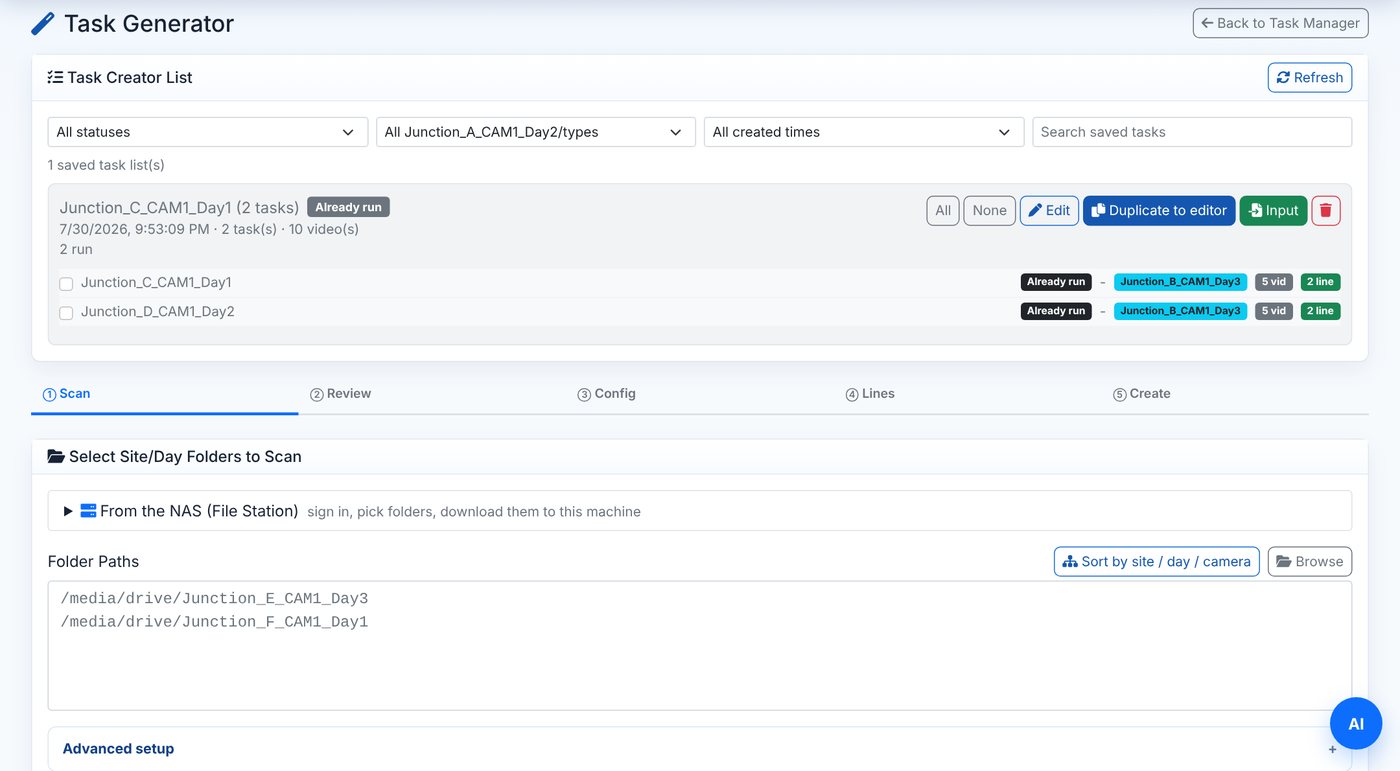
Set up the tasks
Point VehDet at the survey footage. It finds the sites, cameras and days, and makes one task per camera per day.
- Draw counting lines on a picture from each camera, one line per direction
- Reuse the lines on the other days, and adjust them if a camera has moved
- Choose the hours to count, then create the tasks in one go
Run and manage the work
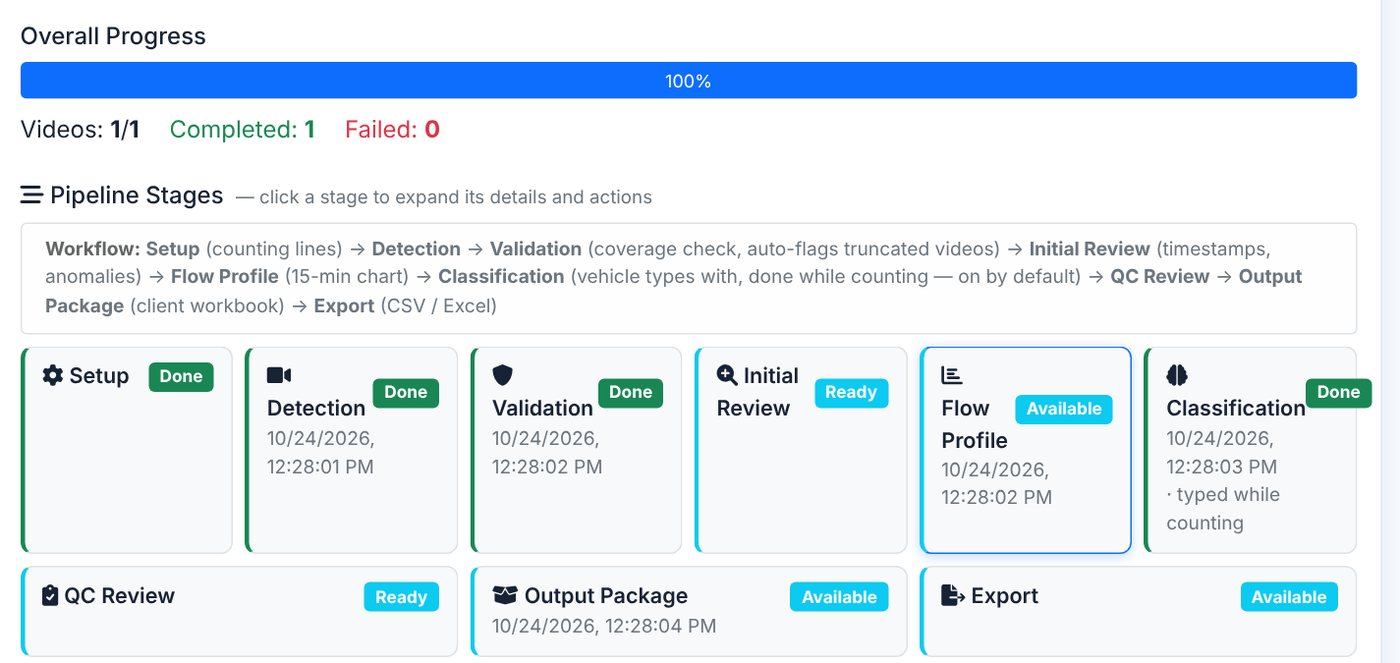
The Task Manager runs tasks on one or many machines, as many at a time as each machine can handle.
- Start, pause, stop and resume tasks. A stopped task carries on where it left off
- Live progress, speed and machine load for every video
- Every video is checked for full coverage, so a missing hour is flagged and never silently dropped
Detect, track and classify
Every vehicle is found in each frame and followed from one frame to the next. It is counted once when it crosses a line, and its type is recorded in the same pass.
- Counts by direction and by road: main carriageway, service roads, slips and U-turns
- Paired lines catch vehicles that one line misses
- Each vehicle's path is saved, so the counts can be worked out again later
Review, analyse and deliver
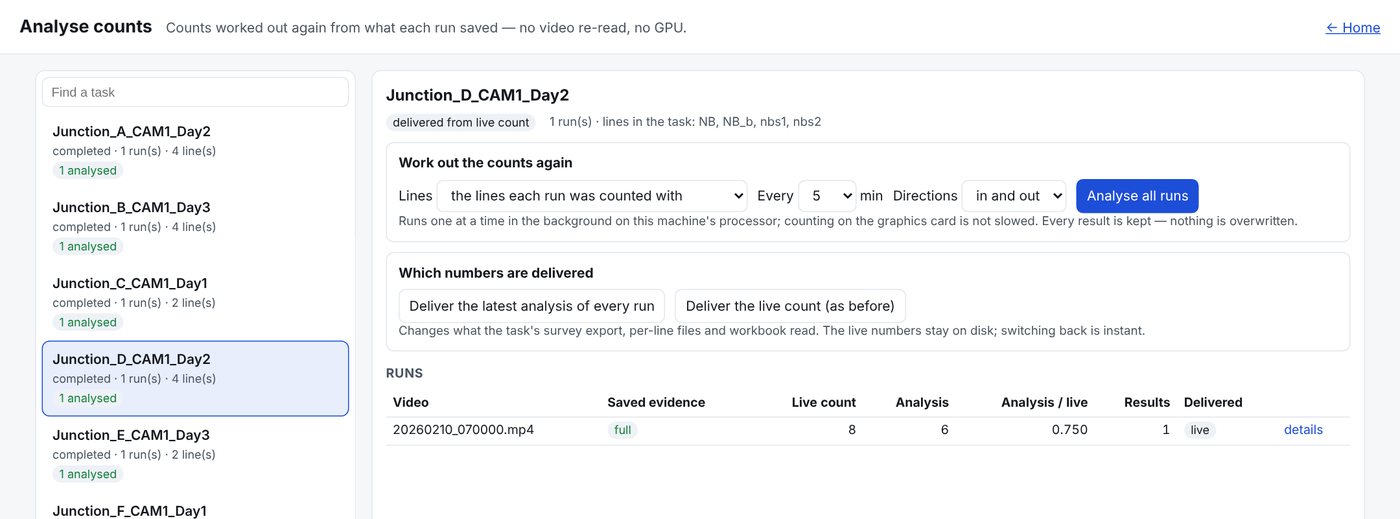
Reviewers check the counts against the video before anything is delivered. If a line was drawn in the wrong place, it can be moved and the count worked out again from the saved paths in minutes, without processing the video again.
- Flow profiles at 5, 15, 30 or 60 minutes, by line and by vehicle type
- Side-by-side comparison with manual counts
- One workbook per site: 15-minute counts for each day, daily totals and charts
See it working on UK streets
We ran VehDet on publicly licensed video from around the UK. Nothing was retouched. The coloured lines are counting lines, each box is a tracked vehicle or person with its type, and the panels show running counts for each line.
What a finished site looks like
These are real numbers from one urban arterial site: the average of five complete weekdays, counted from video. The workbook has the same figures in 15-minute steps for every day.
Average weekday, 15-minute flows
Vehicle mix
Average weekday, both directions
One tool for many kinds of count
Tell us about your survey
Send us the number of sites and cameras, how many days of footage you have, and what you need counted. We will reply with how VehDet can handle it, plus a sample count from your own footage.
Video credits
The street clips are short extracts from videos on Wikimedia Commons. We cut them and added VehDet's detection boxes, counting lines and counts. The clips under CC BY-SA are shared under the same licence.
- Dundee waterfront: “Dundee waterfront roads before redevelopment (Oct 2011)” by Laerol, CC BY-SA 4.0
- M62, Liverpool: “M62 motorway from the Greystone Road footbridge” by Rept0n1x, CC BY-SA 3.0
- Piccadilly Circus, London: “PICCADILLY CIRCUS, London UK 4K” by Kauko Helavuo, CC BY 3.0
- Green Lanes, London: “Arriva S234JUA, Green Lanes N16, London, 25 November 2015” by DAVID HOLT, CC BY 2.0
- Addiscombe Road, Croydon: “Arriva London LJ08CXR in Addiscombe Road, Croydon (February 2016)” by Jontsa73, CC BY 3.0
- Roundabout, London: “London roundabout” by Vcohen, CC BY-SA 4.0
- Royal Mile, Edinburgh: “The Royal Mile, Edinburgh” by Stinglehammer, CC BY-SA 3.0